
Forecast
From manual planning to a living view of cash flow
- Period:
- 2025–2026
- Platforms:
- Web, iOS, Android
- Role:
- research, product design, design mentorship, specs, qa
Key question
How can we help a SME owner understand his next 90 days?
How might we help a SME owner understand the next 90 days quickly and confidently, without requiring them to build and maintain a finance model?
Context
SME owners needed to know whether they would have enough cash for their next decision. Their bank balance showed today; spreadsheets required constant maintenance; specialist forecasting tools were often too expensive.
Over 18 months, we evolved Forecast from a manually maintained table into a clearer, increasingly automatic view of financial reality and intent.
Understand
See where the business is heading
A balance can be accurate and still be misleading: it says nothing about invoices arriving next week, upcoming bills, or a hiring decision planned for next month.
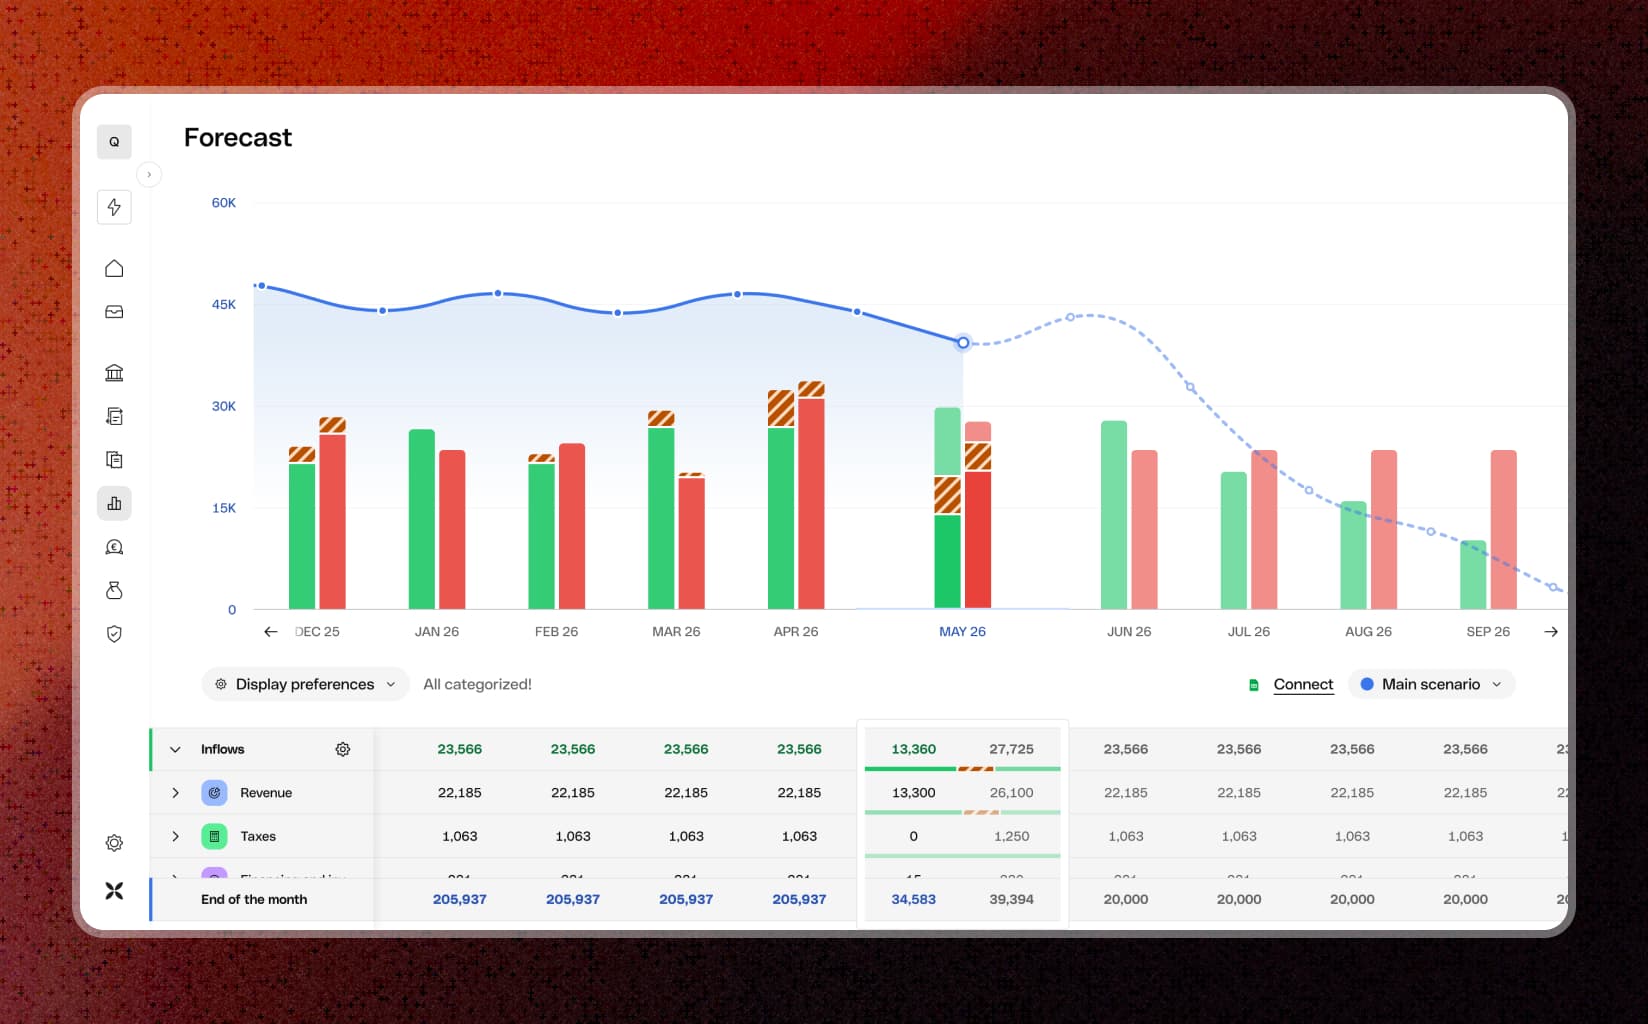
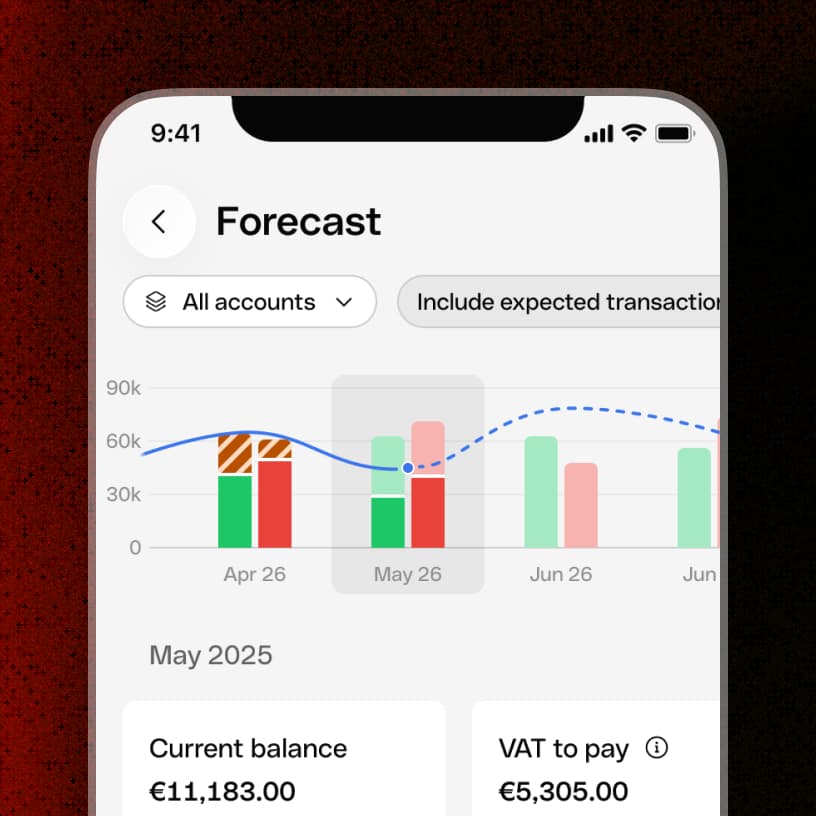
Forecast turns these signals into a readable financial position through:
- a larger, primary chart;
- a running cash-balance line;
- clear past, current, and future periods;
- synchronised chart and table selection;
- condensed secondary information.
Distinguish
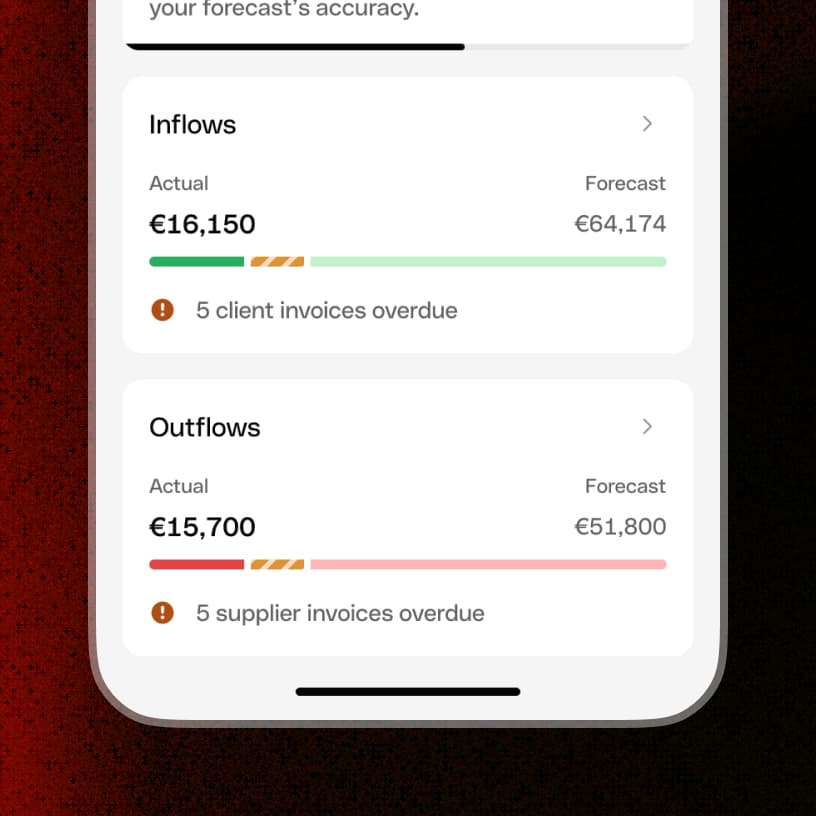
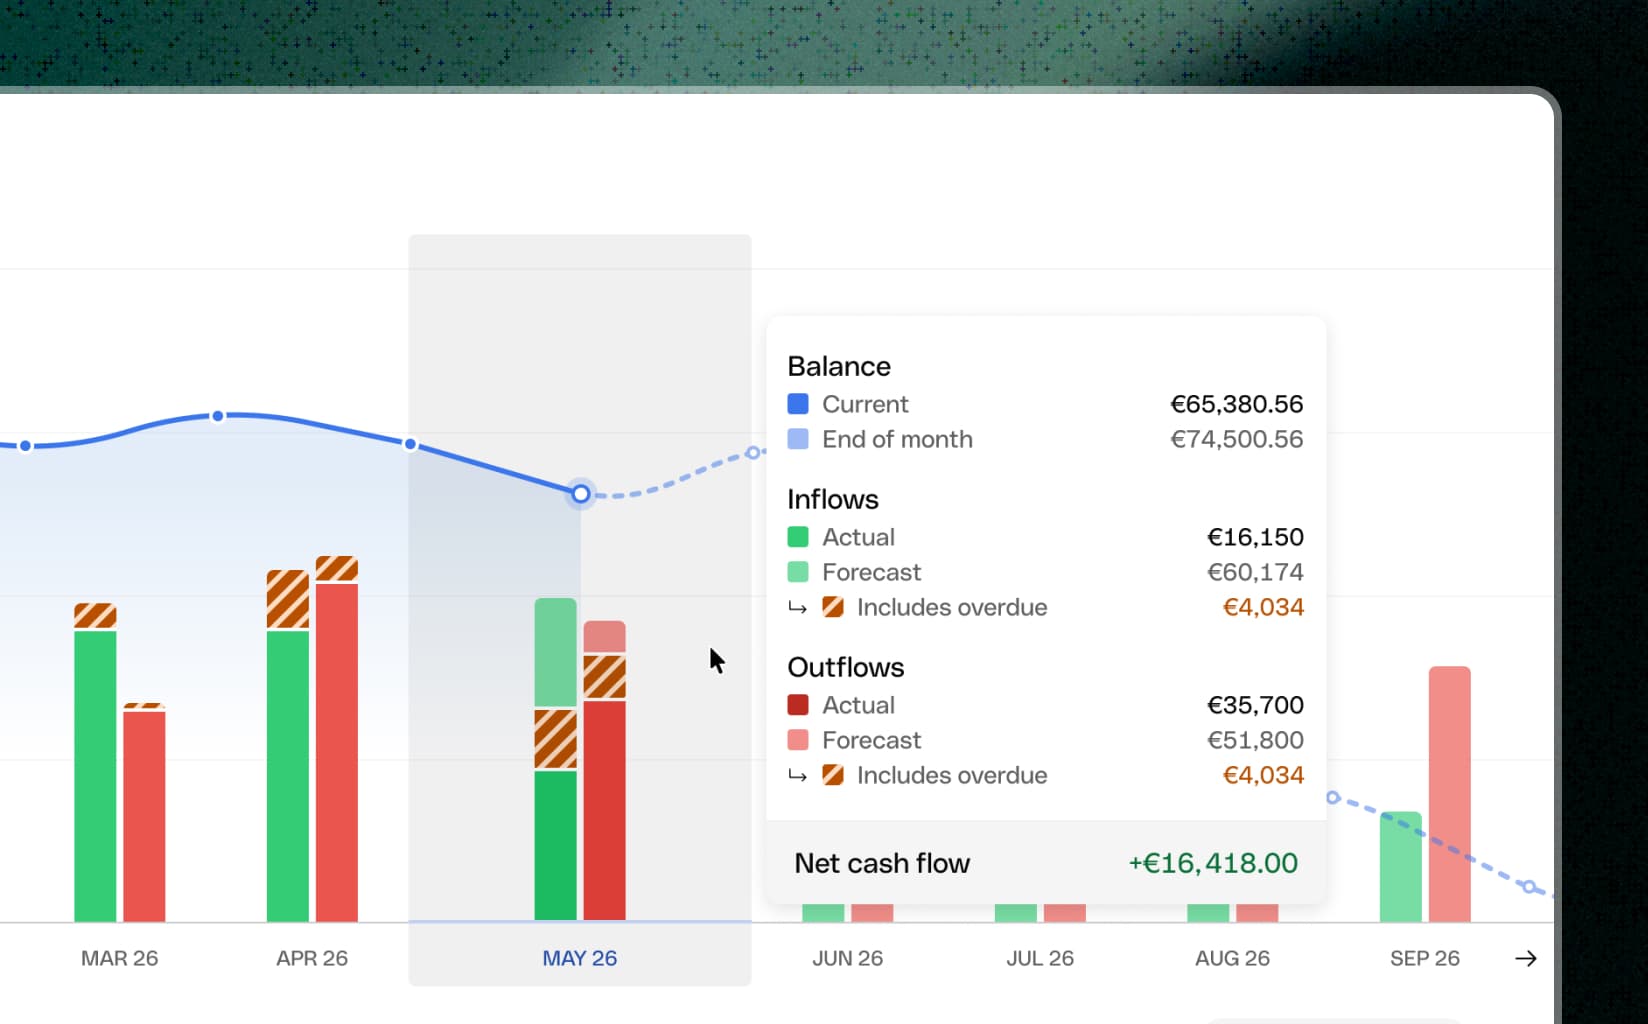
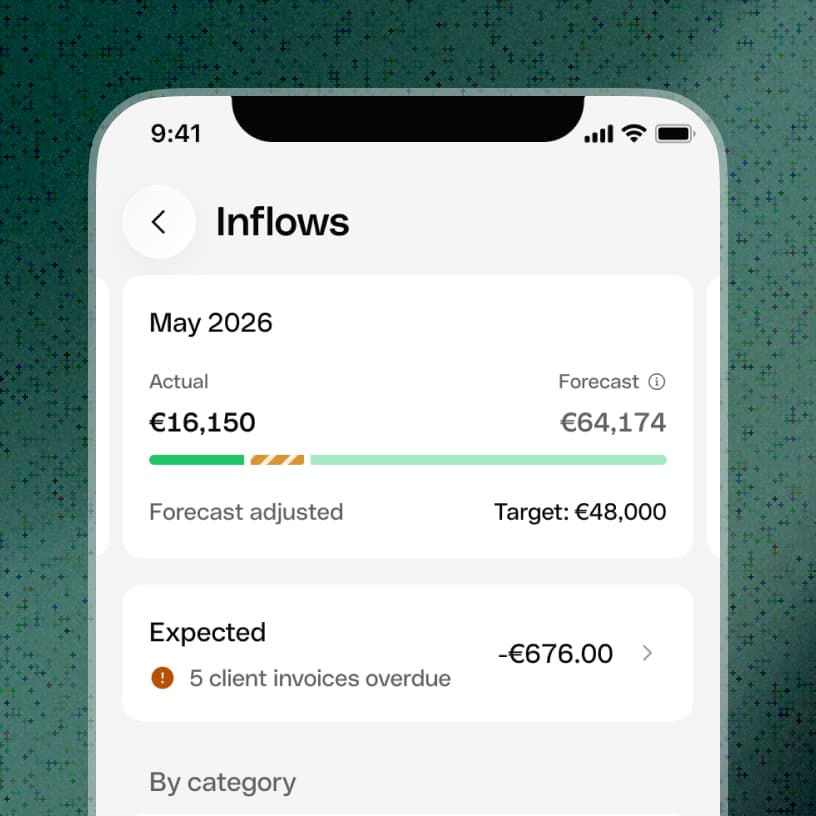
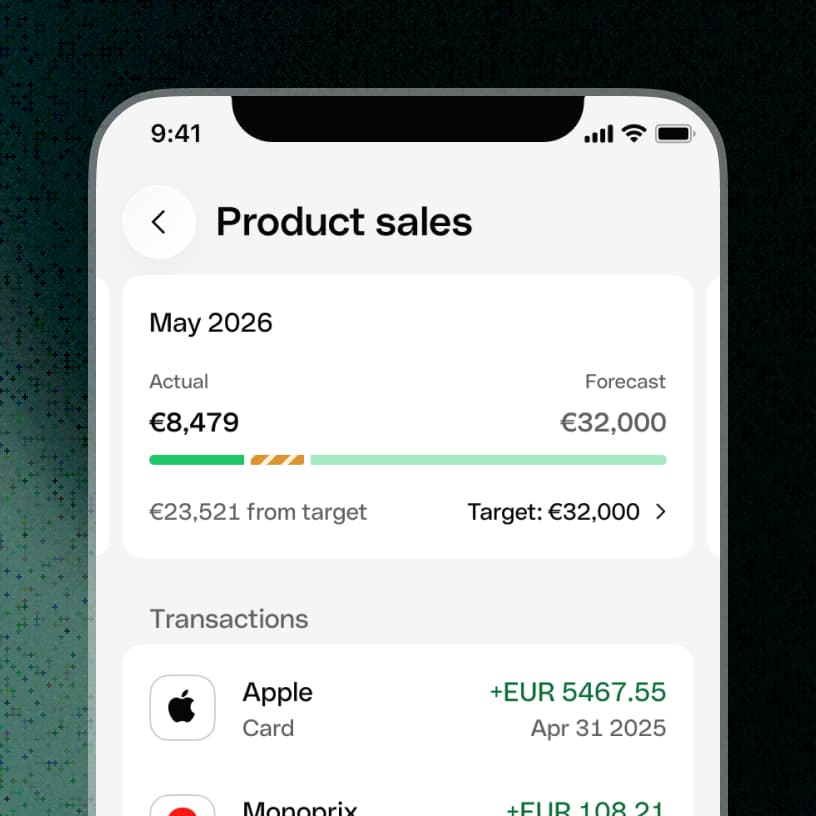
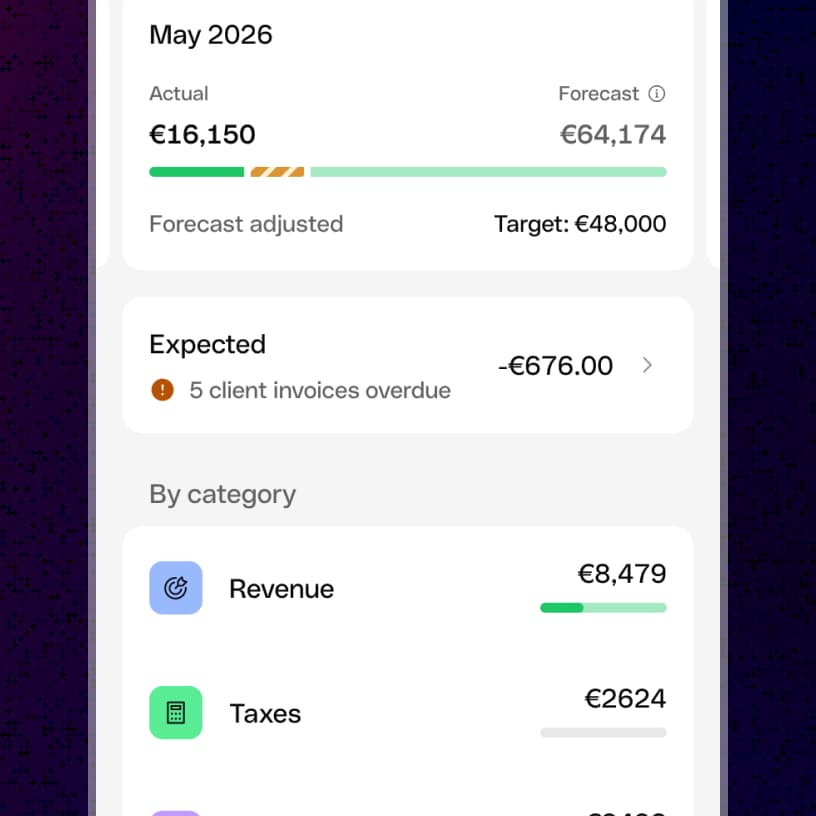
Separate what happened, what is expected, and what the business intends.
The hardest problem was not visualising more data. It was preventing fundamentally different types of information from appearing equally certain.
Forecast follows confirmed reality when it exceeds the target, while preserving the target when ambition is greater than known activity.
Act
Move from a gap to its cause
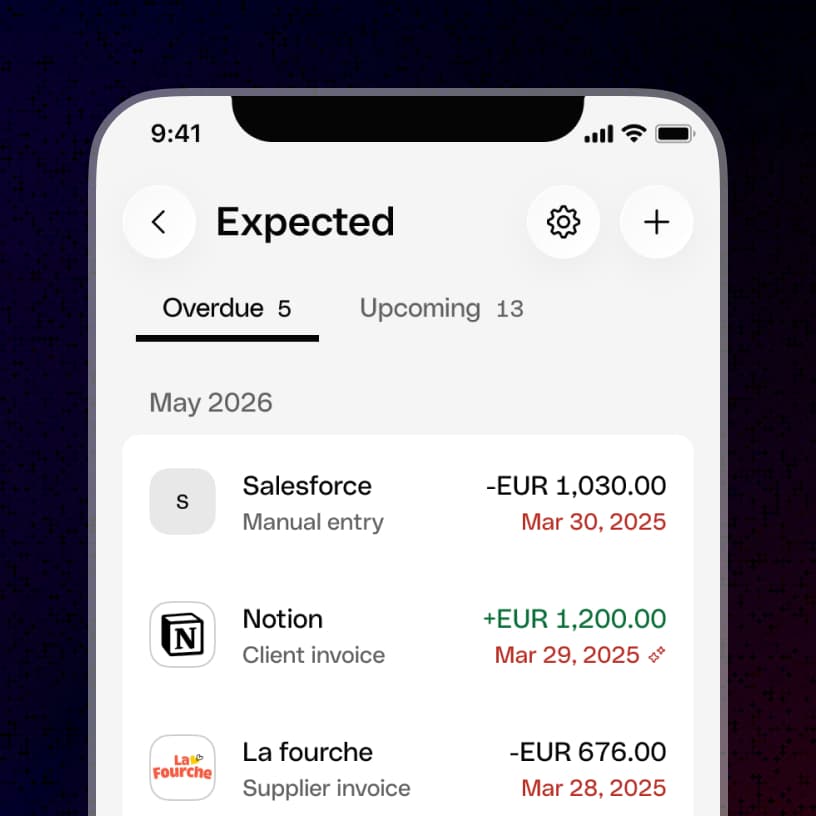
A financial overview is useful only if customers can investigate and respond:
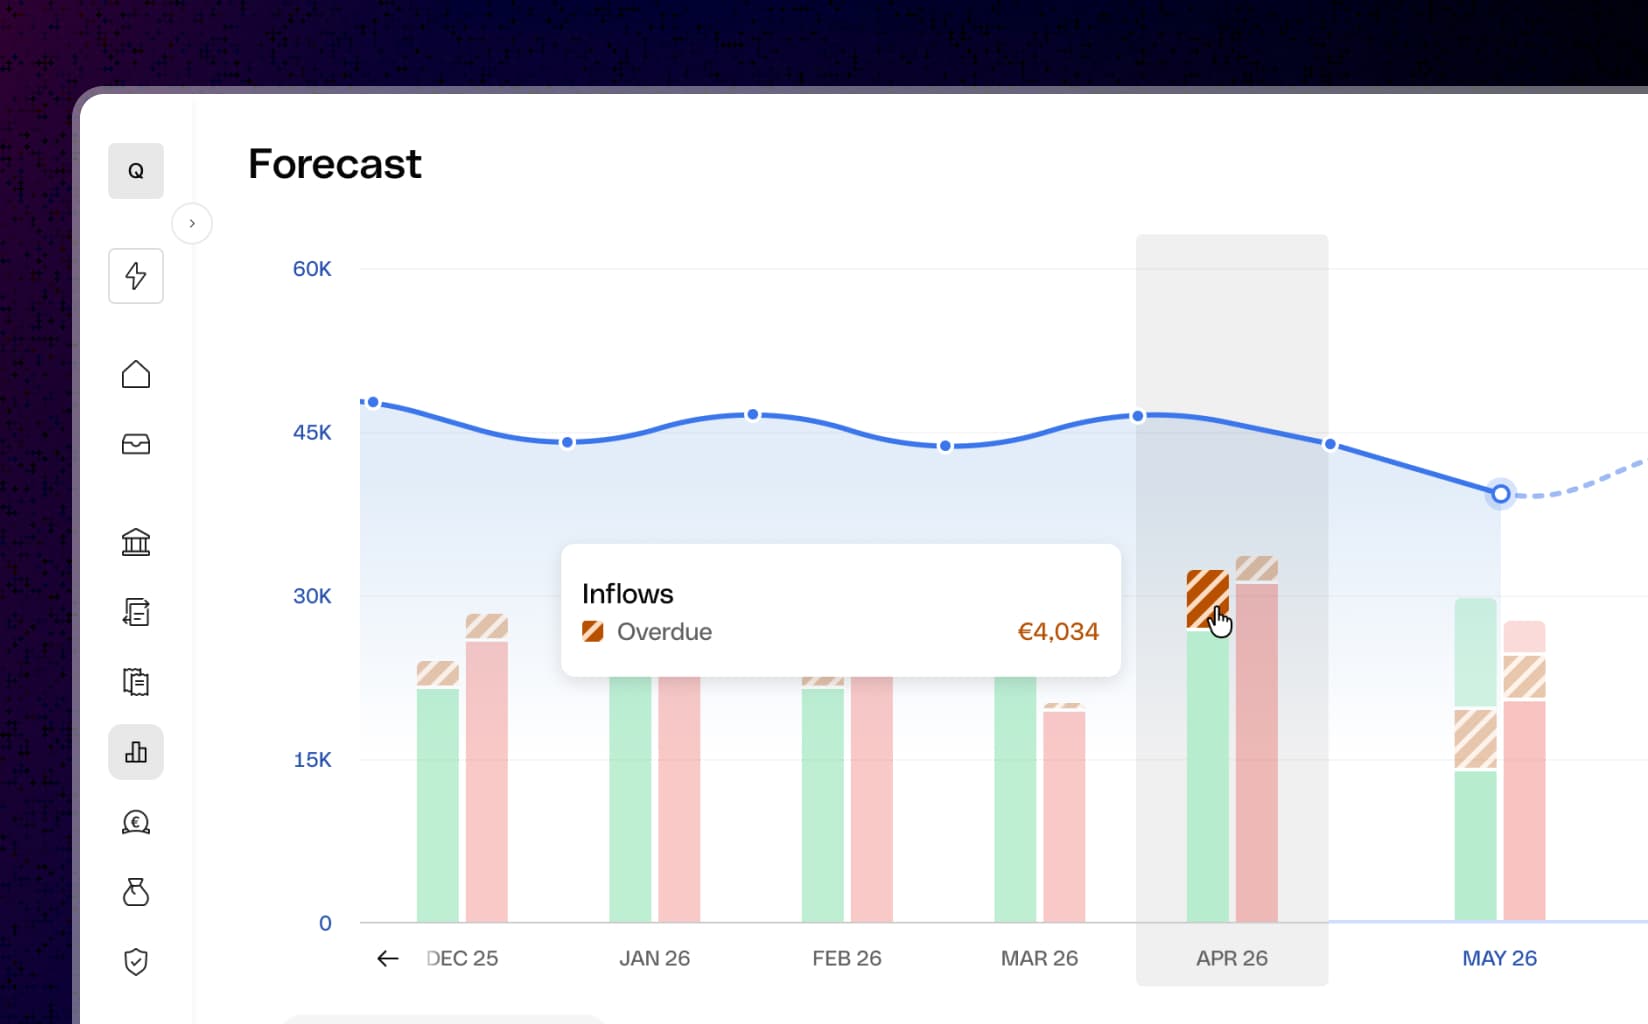
1. Scan the chart.
2. Select a month or table cell.
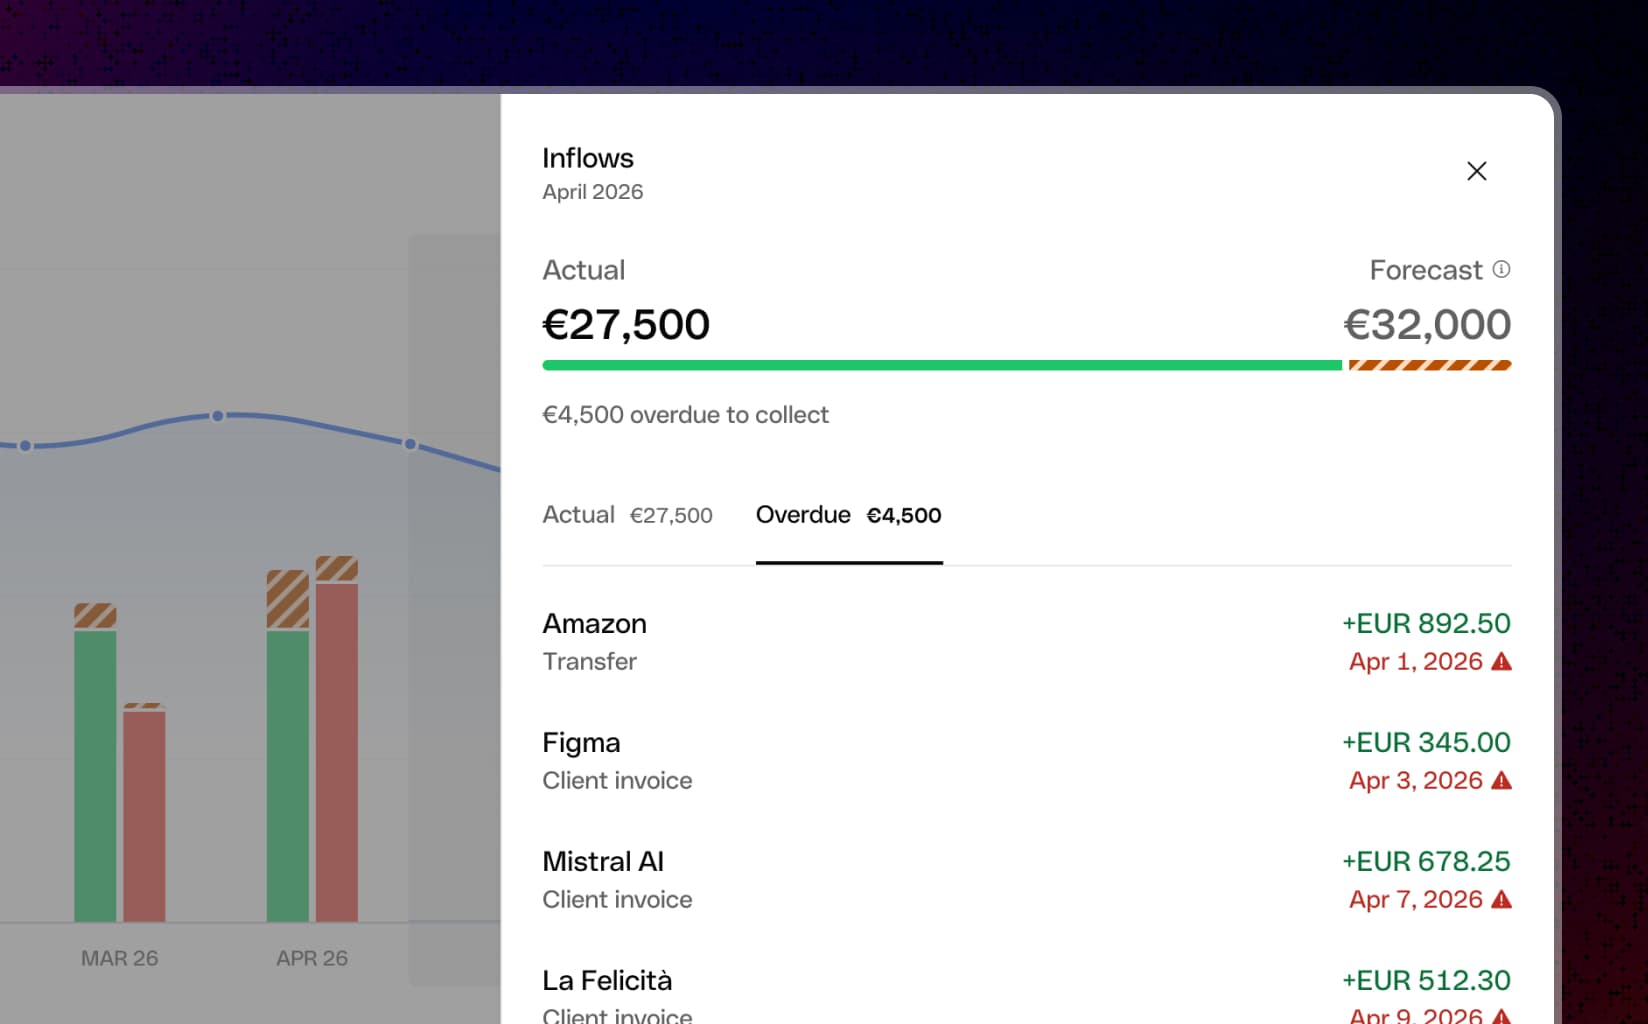
3. Open the contextual side panel.
4. Review Actual, Expected, or Overdue items.
5. Edit an assumption, inspect a commitment, or correct a match.
6. See the projection update in context.
Stay in control
Automate without taking over
The experience balances automation and control through:
- automatic expected transactions;
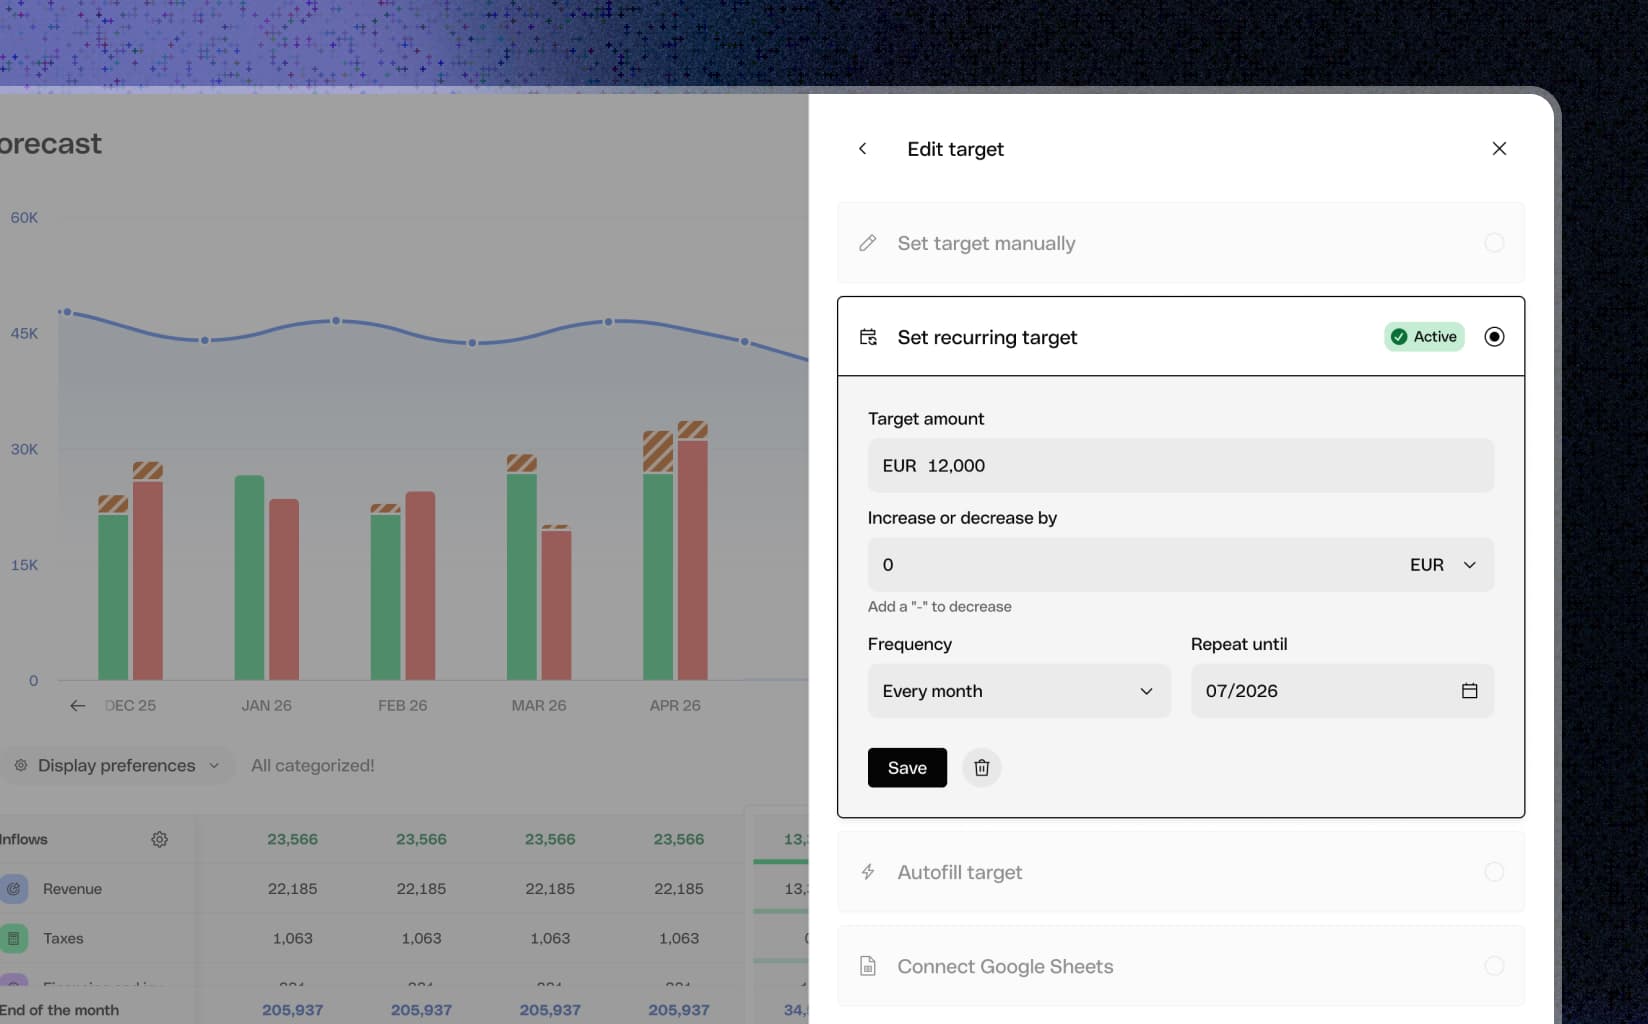
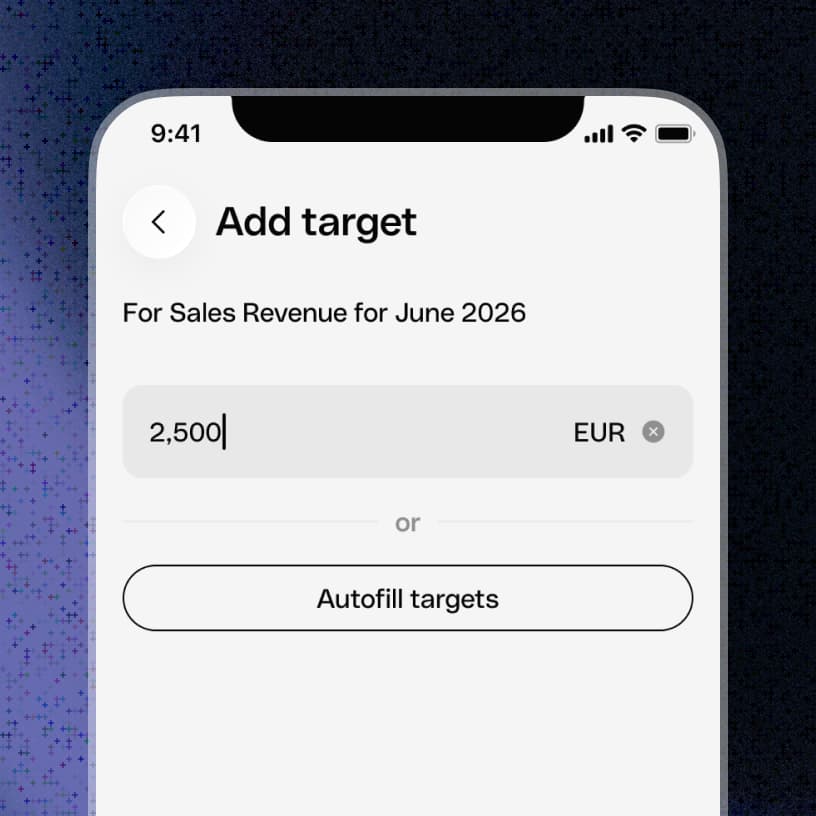
- historical suggestions and autofill;
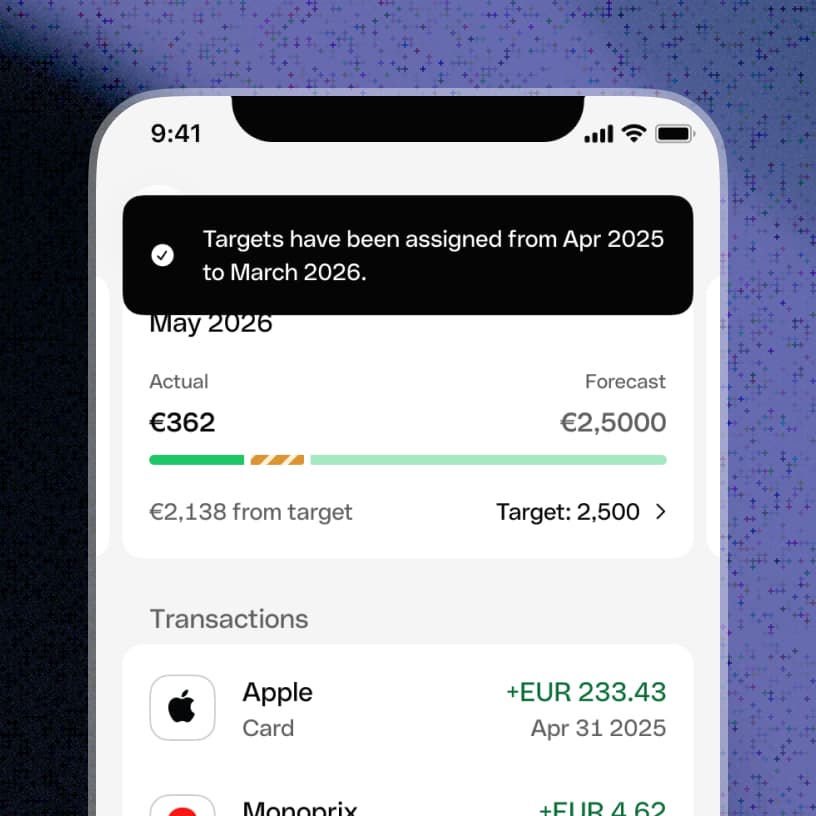
- recurring target values;
- editable monthly assumptions;
- scenarios and comparisons;
- settings that persist across devices;
- clear fallback states when data or permissions are unavailable.
Qonto builds the first picture; the customer remains the decision-maker.
Adoption growth
Monthly active organisations went from 7,109 (Sep 25) to 23,112 (Jul 26)
Discovery to usage
Went from 19,3% (Sep 25) to 55,5% (Jul 26)
Retention month over month
Of active organizations return the following month
How to push further
Shift Forecast from raw-data to decision-ready insights
Shift Forecast from a manual, raw-data planning tool customers must interpret themselves into a system that delivers trustworthy, decision-ready insights — surfaced at the right moment — so customers can act (chase a client, pay an invoice, set a target) without digging into the numbers